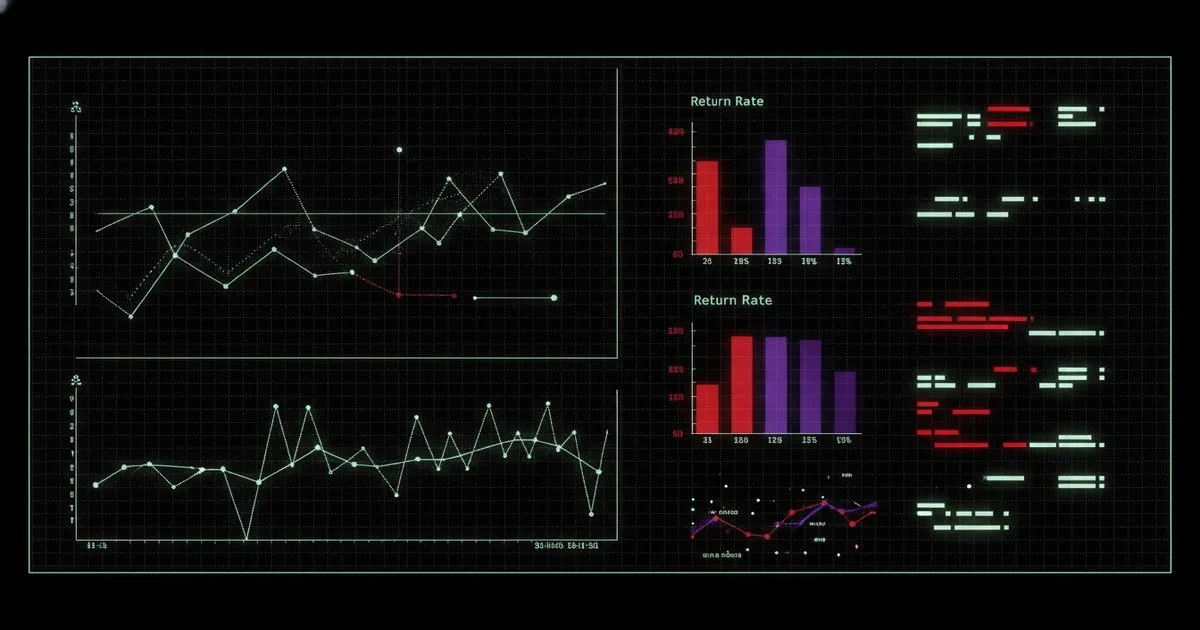
To isolate the causal effect of a virtual try-on (VTO) deployment on return rates, you must implement a randomized controlled trial (RCT) that accounts for the inherent 14-to-30-day return lag. Simply comparing return rates before and after deployment is insufficient because seasonal demand shifts and changes in inventory mix act as confounding variables. A robust measurement framework requires a long-term holdout group and a Difference-in-Differences (DiD) model to filter out external noise.
Key takeaways
- Deploy a persistent, cookie-based holdout group to isolate VTO impact from seasonal trends.
- Use a 30-day attribution window to ensure all potential returns are captured in the post-purchase dataset.
- Segment return reason codes to specifically track "fit and sizing" issues versus "damaged" or "not as described."
- Apply a Difference-in-Differences (DiD) framework to adjust for baseline fluctuations in broader market demand.
- Monitor the "Return-to-Purchase" ratio at the SKU level to identify if VTO effectiveness varies by garment category.
Prerequisites
Before starting the measurement process, ensure your stack includes the following:
- Clean Transaction Logs: Access to raw order data including SKU, category, and timestamp.
- Return Reason Codes: A standardized system where customers must specify why an item is being returned.
- Event Tracking: A system (like Segment or Snowplow) to log
vto_interactionevents tied to a persistentuser_idoranonymous_id. - Statistical Volume: Enough traffic to reach significance; for a 1% reduction in returns, you typically need at least 50,000 transactions across test and control groups.
- Data Warehouse: A centralized environment (BigQuery, Snowflake) to join frontend interaction events with backend fulfillment and return tables.
Introduction
Measuring the success of a virtual try-on deployment is often complicated by the "selection bias" problem: users who engage with VTO tools are often more motivated to buy, which can skew conversion data. However, for returns, the challenge is reversed. You are looking for a reduction in a negative outcome that occurs weeks after the initial interaction. This tutorial provides a technical roadmap for data analysts to build a production-ready attribution model for VTO-driven return reduction.
Step 1: Design the Randomized Controlled Trial (RCT)
Assign a persistent holdout group to ensure that the only difference between user segments is the availability of the VTO interface. Use a hash-based bucketing system on the user_id (or device_id for guests) to ensure a user stays in the same group across multiple sessions.
Implement a 90/10 split—where 90% of your traffic sees the VTO tool and 10% serves as the control group. This allows you to gather enough data for the treatment group while maintaining a statistically valid baseline. The expected result is two distinct cohorts with identical baseline behaviors, allowing for a clean comparison of return rates over time.
Step 2: Instrument the Interaction and Purchase Stream
You must track not just whether a user clicked the VTO button, but whether they completed a "try-on" event (e.g., uploaded a photo or adjusted a digital twin). This distinguishes between casual browsers and high-intent users.
Map every vto_session_id to the final order_id. If a user interacts with a tool like Bold Metrics to generate a digital twin, that specific body-data event should be passed into the checkout metadata. The expected result is a joined table where each line item in an order is flagged as vto_influenced = true or false. This allows for granular analysis of whether the VTO tool actually influenced the specific item that was either kept or returned.
Step 3: Define the Return Attribution Window
Returns do not happen in real-time. According to research on virtual try-on adoption, the information obtained during a virtual session significantly impacts the consumer's post-purchase evaluation. Therefore, you cannot calculate the impact of a VTO deployment on the day of the sale.
Set a mandatory 30-day cooling-off period before calculating the final metrics for any given cohort. If a user buys a technical shell from a brand like Arc'teryx (owned by Amer Sports), they may test the fit at home for a week before deciding to return it. The expected result is a rolling 30-day reporting lag that provides the "Ground Truth" for return rates, preventing premature (and likely over-optimistic) reporting.
Step 4: Normalize for Category and Market Confounders
External factors often mask the performance of fit tools. For instance, WWD reported on August 17, 2026, that wholesale transactions in the Middle East rose by 18 percent in the first half of the year, a surge that could lead to higher return volumes simply due to increased scale, regardless of VTO efficacy.
To normalize for this, segment your data by product category. Fit-heavy categories like denim or structured outerwear will show different VTO impacts compared to accessories or oversized tees. Use True Fit data or similar fit-recommendation signals to identify which SKUs have the highest "fit-risk." The expected result is a weighted return rate that accounts for the specific product mix purchased by each group, ensuring that a sudden surge in "easy-fit" items doesn't falsely credit the VTO tool.
Step 5: Implement the Difference-in-Differences (DiD) Model
The DiD model compares the changes in outcomes over time between the treatment group (VTO users) and the control group. This is crucial because it filters out time-variant factors that affect both groups equally, such as a site-wide sale or a global logistics delay.
As AI architectures evolve, the ability to process these complex datasets in real-time is increasing. For example, Meta released Glimmer on August 14, 2026, an open-weight model that highlights the trend toward accessible, high-performance AI that can be used to automate complex data cleaning and attribution tasks. Use a regression model where the dependent variable is is_returned and the independent variables include is_treatment_group, time_period, and the interaction term is_treatment_group * time_period. The coefficient of the interaction term is your causal impact.
Warning: Ensure the "Parallel Trends Assumption" holds. The return rates for both groups should have been moving in tandem before the VTO tool was enabled. If they weren't, your DiD result will be biased.
Step 6: Audit for Selection Bias with Intent-to-Treat (ITT)
A common error is only comparing VTO users to non-users within the treatment group. This is biased because users who choose to use VTO are fundamentally different from those who don't. Instead, use an Intent-to-Treat (ITT) analysis: compare the entire 90% treatment group (regardless of whether they actually clicked the VTO button) against the 10% control group.
This provides a conservative, real-world estimate of the tool's impact on your total business. For a more focused view, you can use instrumental variable (IV) estimation to recover the effect on the "compliers" (those who actually used the tool). The expected result is a range of impact—from the total site-wide reduction to the specific per-user reduction for those who engaged with tools like Fit Analytics, now operated by Snap Inc.
Troubleshooting
| Issue | Likely Cause | Resolution |
|---|---|---|
| Return rate increased | Selection Bias | Check if the VTO group is buying more "high-risk" items (e.g., formal wear) than the control. |
| No statistical significance | Low Sample Size | Extend the test duration or increase the traffic split to 50/50 temporarily. |
| Inconsistent reason codes | CX Friction | Audit the return portal; ensure "Fit" is a top-level reason code. |
| Data mismatch | Attribution Lag | Ensure you are joining orders to returns based on the original order date, not the return date. |
Expected Outcomes
Upon successful implementation of this measurement framework, you will move from anecdotal evidence to a verified causal impact. For a major platform like Zalando, which manages millions of active customers, even a 0.5% reduction in returns translates to millions in saved reverse-logistics costs. Success looks like a stable, statistically significant delta between your ITT groups that persists across at least two full return cycles (60+ days).
FAQ
How do I handle users who return only part of an order? Analyze return rates at the item level, not the order level. An order is not "returned"; a SKU is. By tagging each SKU with its VTO-interaction status, you can determine if the tool successfully helped the user select the correct size for that specific garment, regardless of other items in the cart.
Why is a 90/10 split better than 50/50? In a production environment, a 50/50 split can be expensive if the VTO tool is already known to improve conversion. A 90/10 split minimizes the opportunity cost while still providing a sufficiently large control group to detect significant shifts in return behavior over a 30-to-60-day window.
Can I measure impact without a holdout group? It is possible using synthetic control methods or interrupted time-series analysis, but these are significantly less accurate. Without a concurrent holdout, you cannot definitively prove that a drop in returns wasn't caused by a change in your marketing mix or a seasonal shift in consumer behavior.
What if the VTO tool increases conversion but also increases returns? This is why you must track "Net Contribution per User." If the conversion lift outweighs the cost of the additional returns, the deployment is still a net positive. However, a high-quality VTO deployment should ideally increase confidence, leading to higher conversion and lower returns simultaneously.
Further reading
- Adoption of Virtual Try-on technology for online apparel shopping
- Wholesale Volumes Are Improving in the Middle East
- Does Mark Zuckerberg really believe AI is for everyone?