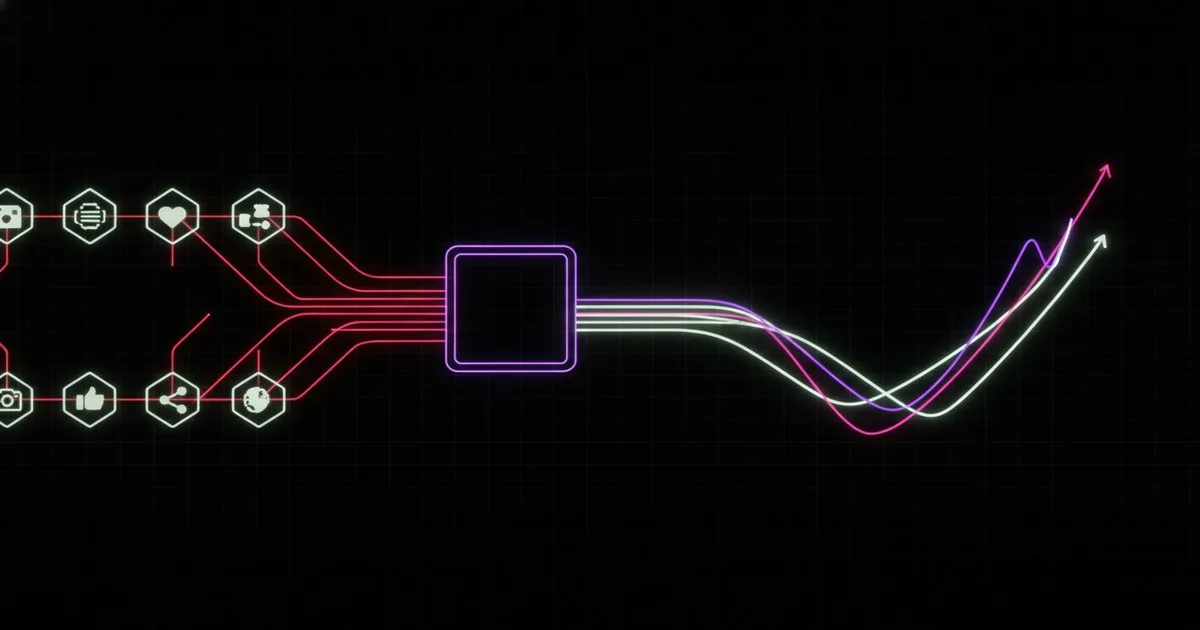
Trend signal aggregation is the architectural process of transforming high-volume, unstructured visual data from social media and e-commerce streams into structured, quantified trend trajectories. For a data engineer, this involves building a multi-stage pipeline that handles massive image ingestion, high-throughput computer vision inference, and complex time-series smoothing to eliminate noise. The goal is to move beyond qualitative "mood boards" toward a deterministic model of market demand.
Key takeaways
- Effective trend aggregation requires a hardened pipeline capable of processing millions of images daily with minimal deduplication errors.
- Computer vision models must be trained on granular fashion taxonomies to distinguish between subtle silhouette variations.
- Signal weighting algorithms must account for platform-specific biases and influencer authority to prevent data skew.
- Time-series smoothing, such as seasonal decomposition, is essential to separate recurring cycles from structural shifts.
- Integration with internal merchandising data turns external signals into actionable inventory decisions.
How does the image ingestion pipeline handle scale?
The first stage of any trend intelligence platform is the ingestion of raw data. This typically involves scraping or API-based collection from platforms like Instagram, TikTok, and Pinterest. At an enterprise level, your system must ingest millions of images per day. The primary engineering challenge here is not just the volume, but the diversity and quality of the data.
Your pipeline needs a robust deduplication layer. In fashion, the same image—often a high-performing influencer post or a brand campaign—is reposted thousands of times across different accounts. If your system counts every instance as a unique signal, it creates an "echo chamber" bias that artificially inflates a trend's score. Engineers use perceptual hashing (pHash) or feature vector comparisons to identify and group duplicate images at the point of entry. This ensures that the signal strength reflects unique consumer adoption rather than viral repetition.
Furthermore, the system must handle rate limits and data variety. While social media provides the "as-worn" signal, e-commerce platforms provide the "as-sold" or "as-offered" signal. For instance, AliExpress announced on August 17, 2026, that it is implementing service enhancements like an in-stock guarantee to improve shopping reliability https://wwd.com/sourcing-journal/industry-news/aliexpress-adds-enhancements-to-improve-shopping-returns-1239126495/. These types of retail shifts are ingested as secondary signals to validate whether a visual trend is actually translating into commercial availability.
What happens during classifier inference?
Once an image is ingested and deduplicated, it enters the computer vision (CV) inference engine. This is where the unstructured pixels are converted into a structured feature set. A typical fashion AI platform uses a hierarchical classification system.
A platform like Heuritech, which was acquired by Luxurynsight in December 2024 to integrate visual signals into a broader luxury data suite, utilizes deep learning models to detect hundreds of attributes per image. The inference stack usually performs several concurrent tasks:
- Object Detection: Locating specific items (e.g., a jacket, a pair of boots).
- Attribute Tagging: Identifying granular details like neckline shape, sleeve length, fabric texture (denim, leather, knit), and print (leopard, floral).
- Color Extraction: Mapping pixels to a standardized color space (like Pantone or a proprietary brand palette) while accounting for lighting conditions and filters.
- Contextual Analysis: Determining where the garment is being worn (e.g., street, beach, red carpet) to weight the trend's relevance.
For engineers, the challenge is maintaining high accuracy across diverse body types, poses, and occlusions. Models are often trained on millions of labeled images using architectures like EfficientNet or Vision Transformers (ViT). The output of this stage is a JSON object for every image, containing a list of detected attributes and their associated confidence scores.
How is time-series smoothing applied to fashion signals?
Raw trend data is incredibly noisy. A sudden spike in "neon green" might just be a single viral event or a holiday-specific surge. To provide actionable insights, the platform must apply time-series smoothing. This involves aggregating the daily counts of specific attributes and applying statistical filters to identify the underlying trend line.
Common techniques include:
- Moving Averages: Simple or exponential moving averages help smooth out daily fluctuations.
- Seasonal Decomposition: Using algorithms like STL (Seasonal-Trend decomposition using Loess) to strip away predictable seasonal effects (e.g., coats in winter) and reveal the "residual" trend—the part of the signal that is actually new or growing.
- Anomaly Detection: Identifying and flagging outliers that could skew the data, such as a celebrity wearing a costume that doesn't reflect broader market behavior.
The resulting "Trend Score" is a composite metric. It isn't just a count of images; it is a measure of growth rate, acceleration (the "momentum" of the trend), and reach across different consumer segments. This allows planners to see not just what is popular now, but what will be popular in six months.
What are the weighting mechanisms for signal strength?
Not all images are created equal. A post from a Tier-1 influencer with five million followers carries more weight than a post from a private account with fifty. However, over-weighting influencers can lead to "influencer bubbles" where a trend appears larger than it is because it is being pushed by a small, vocal group.
Engineers build weighting matrices that factor in:
- Source Authority: The historical accuracy and reach of the source.
- Engagement Velocity: How quickly the image is gaining likes, shares, and comments relative to the account's baseline.
- Geographic Spread: Is the trend localized to Seoul and Paris, or is it spreading globally?
- Platform Multiplier: A trend appearing on TikTok (high discovery) and Pinterest (high intent) simultaneously is weighted more heavily than a trend appearing on only one platform.
In the broader AI infrastructure market, the capital required to build and scale these sophisticated systems is significant. For example, Wispr raised $280 million in Series B funding on August 17, 2026, reaching a $2 billion valuation https://techcrunch.com/2026/08/17/wispr-raises-280m-at-2b-valuation-as-it-looks-beyond-dictation/. While Wispr focuses on voice interfaces, the scale of investment reflects the massive compute and data engineering costs associated with enterprise-grade AI platforms that must process global data streams in real-time.
How do you integrate external signals with internal data?
The final stage of aggregation is contextualization. A trend signal is only useful if a brand can act on it. This requires connecting the external trend data with internal merchandising and planning tools. Platforms like Style Arcade focus on this integration, helping teams combine visual trend insights with their own sales data, inventory levels, and size curve analytics.
When external signals (e.g., "oversized blazers are up 40%") are mapped against internal performance (e.g., "our current blazer stock has a 20% sell-through rate"), the system can generate specific recommendations. This might include "increase buy for Q3" or "markdown existing inventory to make room for new silhouettes."
Comparison of Trend Intelligence Approaches
| System Type | Best For | Limits |
|---|---|---|
| Social Listening (Text-based) | Sentiment analysis and brand mentions. | Fails to capture visual nuances or specific garment attributes. |
| CV-first Platforms | Granular attribute tracking and early trend detection. | Requires massive compute; can be disconnected from sales reality. |
| Merchandising Analytics | Inventory optimization and range planning. | Often relies on historical data rather than forward-looking signals. |
| Integrated AI Suites | End-to-end decision making for enterprise brands. | High implementation cost and complex data pipeline maintenance. |
What are the security risks in trend data pipelines?
As fashion brands become more dependent on these AI platforms, the security of the data and the accounts becomes paramount. If a competitor gains access to a brand's custom trend dashboards, they gain insight into that brand's future product strategy. Security remains a critical bottleneck for the industry; a report on August 15, 2026, highlighted how to detect if AI platform accounts have been compromised and the steps needed to secure them https://techcrunch.com/2026/08/15/how-to-tell-if-your-ai-platforms-accounts-have-been-hacked/.
Engineers must implement strict tenant isolation and multi-factor authentication (MFA) to ensure that trend signals—which are often proprietary when combined with internal sales data—remain confidential. This is especially true for luxury brands that use these signals to maintain exclusivity and market positioning.
FAQ
How do you handle low-resolution social images? Inference engines use super-resolution pre-processing or models trained specifically on "in-the-wild" data. By using robust feature extraction rather than pixel-perfect matching, the system can identify attributes even in grainy or poorly lit photos. Confidence thresholds are adjusted based on image quality to ensure noisy data doesn't degrade the aggregate signal.
What is the latency for a new trend signal? Most enterprise pipelines operate on a 24-to-48-hour refresh cycle. While ingestion is near real-time, the aggregation and smoothing stages require a temporal window to identify meaningful movement. "Fast-response" modules can flag viral spikes within hours, but structural trend scores require more data points to stabilize.
How does the system distinguish between a costume and a trend? Contextual classifiers analyze the background and metadata of an image. If a garment is detected primarily in "party" or "performance" contexts and lacks a corresponding rise in e-commerce availability or street-style adoption, the system weights it as a costume or niche event rather than a commercial trend.
Can these systems predict "black swan" fashion events? AI is inherently retrospective; it predicts the future based on patterns in the past. While it can detect the start of a black swan event faster than a human analyst, it cannot predict a truly unprecedented shift. It excels at identifying the acceleration of existing latent signals rather than inventing new ones.
How do you normalize data across different social platforms? Normalization involves creating a "Common Trend Unit." Since a "like" on TikTok represents different intent than a "pin" on Pinterest, engineers apply platform-specific weights. These weights are calibrated using historical correlations between platform engagement and subsequent retail sales to ensure parity in the final score.
What role does NLP play in a visual trend pipeline? Natural Language Processing (NLP) is used to analyze captions, hashtags, and comments. This provides the "why" behind the "what." If a visual search identifies "red dresses" but the NLP analysis shows the comments are negative or mocking, the trend score is adjusted downward to reflect poor consumer sentiment.
Further reading
- AliExpress Adds Enhancements to Improve Shopping Experience
- Wispr raises $280M at $2B valuation as it looks beyond dictation
- How to tell if your AI platforms’ accounts have been hacked